
The Greater Atlanta housing market continued to shift toward a more balanced environment in July 2026. Home prices remained relatively strong, but fewer homes went under contract or closed compared with July of last year. At the same time, buyers-particularly those shopping for condos and townhomes-generally had more choices.
The July market report from First Multiple Listing Service (FMLS) covers Cherokee, Clayton, Cobb, DeKalb, Douglas, Fayette, Forsyth, Fulton, Gwinnett, Rockdale and Paulding counties.
So, what do all the numbers actually mean for someone thinking about buying or selling a home in metro Atlanta? Here’s a simpler look at the July data.
Home Prices Are Still Holding Up
Despite slower sales activity, prices for detached homes continued to rise.
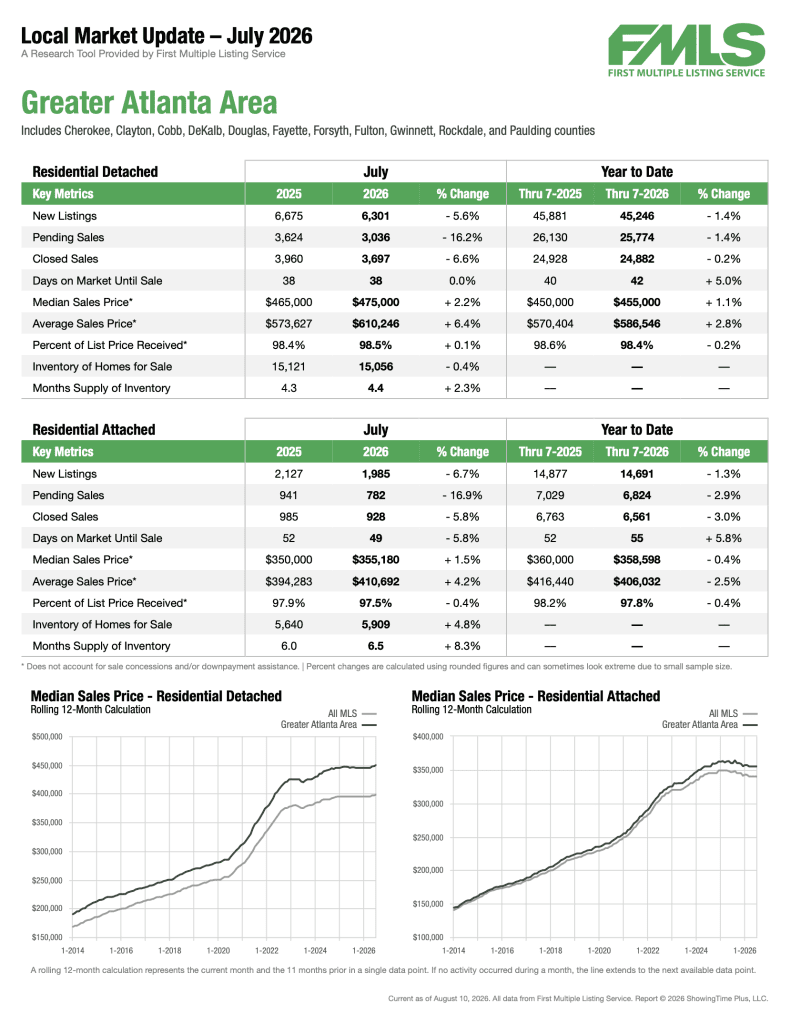
The median sales price for a detached home in Greater Atlanta was $475,000 in July, up 2.2% from $465,000 in July 2025. The average sales price increased even more, rising 6.4% to $610,246. Through the first seven months of 2026, the median detached-home price was $455,000, up 1.1% from the same period last year.
That’s an important distinction in today’s market: slower sales don’t necessarily mean falling home prices.
Fewer Homes Are Selling
Where the slowdown becomes much more noticeable is in the number of transactions.
There were 3,697 detached homes sold in July, down 6.6% from July 2025. More significantly, pending sales fell 16.2%, from 3,624 last July to 3,036 this July. New listings were also down 5.6%.
Pending sales are worth watching because they represent homes that have gone under contract but haven’t closed yet. A sizable drop in pending sales can be an indication that buyer activity has cooled.
Looking at the year as a whole, however, the market has been much steadier. Through July, detached closed sales were down just 0.2% compared with the same period in 2025.
In other words, July was noticeably slower than last July, but 2026 overall has remained relatively close to 2025’s sales pace.
Buyers Have More Breathing Room
Greater Atlanta had 15,056 detached homes for sale in July and a 4.4-month supply of inventory. That’s up slightly from a 4.3-month supply in July 2025.
“Months of supply” is simply an estimate of how long it would take to sell the homes currently on the market if no additional homes were listed.
For consumers, the important takeaway is that the market is no longer as heavily tilted toward sellers as it was during the extremely competitive years earlier this decade.
Buyers generally have more opportunity to compare homes, consider pricing carefully and negotiate. Sellers, meanwhile, need to pay closer attention to their competition and make sure their home is positioned appropriately from the beginning.
Sellers Are Still Getting Close to Asking Price
One statistic that may surprise sellers is how close homes are still selling to their asking prices.
Detached homes sold for an average of 98.5% of their list price in July, virtually unchanged from 98.4% a year earlier. The typical time from listing to sale also remained at 38 days.
That doesn’t mean every seller can simply choose an aggressive price and expect to receive it. Rather, it suggests that homes that successfully make it to closing are still selling relatively close to their listed prices.
Correct pricing remains especially important as buyers gain more choices.
Condos and Townhomes Tell a Different Story
The attached-home market-which generally includes condominiums and townhomes-shows more evidence of a buyer-friendly environment.
There were 5,909 attached homes available for sale in July, up 4.8% from a year earlier. Months of supply increased from 6.0 months to 6.5 months, an 8.3% increase.
At the same time, pending sales dropped 16.9% and closed sales declined 5.8% compared with July 2025.
Prices haven’t collapsed, however. The median attached-home sales price was $355,180 in July, 1.5% higher than a year earlier, while the average price increased 4.2% to $410,692.
Looking at the first seven months of the year provides a little more perspective. The year-to-date median attached-home price was $358,598, down just 0.4% from 2025, while the average sales price was down 2.5%.
What Does This Mean if You’re Selling?
The Atlanta market is still producing solid prices, but sellers should recognize that today’s buyer has more options.
A home that is priced appropriately and presented well can still sell successfully. But sellers may have less room to “test the market” with an overly ambitious asking price, particularly when competing properties are readily available.
The July numbers also reinforce why it’s important to look at your specific neighborhood and property type rather than relying solely on headlines about the Atlanta market as a whole.
What Does This Mean if You’re Buying?
For buyers, the current market offers something that was difficult to find during the most competitive years: time and choice.
There are more opportunities to compare properties and evaluate whether a home’s condition and asking price make sense. The increase in attached-home inventory may be particularly helpful for buyers considering condos or townhomes.
That doesn’t mean desirable homes can’t still attract strong interest. It simply means buyers may have more negotiating leverage than they did when inventory was extremely limited.
The Bottom Line
July’s numbers point to a Greater Atlanta market that is slowing without experiencing a broad decline in home values.
Detached-home prices were higher than a year ago, sellers continued to receive close to their asking prices, and year-to-date detached sales were nearly even with 2025. At the same time, July pending sales fell sharply, transaction volume slowed, and inventory conditions continued to improve for buyers.
The attached market has shifted further, with a 6.5-month supply of homes and more inventory than last year.
Rather than a market that clearly favors one side, Greater Atlanta increasingly looks like a market where the individual property, neighborhood, condition and asking price matter.
For buyers and sellers alike, that’s a good reason to look beyond broad national housing headlines and focus on what’s happening in the local market-and, ultimately, in the specific neighborhood where you’re buying or selling.
Source: First Multiple Listing Service (FMLS), Greater Atlanta Area Local Market Update, July 2026. Data current as of August 10, 2026. Sales-price statistics in the FMLS report do not account for seller concessions and/or down-payment assistance.